Introduction and Overview
Welcome to our November monthly report. As is our practice in these commentaries, we aim to highlight topical matters and assess their potential impact on financial markets. In this edition, we focus on the current euphoria in the public credit and equity markets. We question whether the current valuations are sustainable, especially given the ongoing influx of Treasuries, a matter we examined in detail in our November 4, 2024 report. We begin by reviewing data and indicators of market euphoria, as, in our view, both equity and debt markets exhibit signs of over-optimism. While equity markets provide more readily available data, mispricing of risk is also evident in credit markets. Overarchingly, the debate between bulls and bears continues, with bulls highlighting AI-driven efficiencies and bears emphasizing valuation concerns.
Are Markets Overpriced?
In analyzing US equity markets, we want to highlight the S&P’s rally which has been driven by two key factors: earnings growth and multiple expansion. The former reflects healthy expectations for nominal GDP, while the latter is fueled by sentiment and optimism about future earnings. There are several ways to assess how expensive the S&P has become, including reported P/E ratios, forward (projected) P/E ratios, and cyclically adjusted earning measures like the Shiller P/E ratio. Approaches to averaging also vary—you can calculate P/E ratio for each component and then average them, or divide the total price by the total earnings of the S&P (a harmonic mean for the math enthusiasts). The limitation of focusing solely on P/E metrics is that they don’t account for earnings growth, which is a more objective measure. Let’s dive into the data and charts, starting with the Shiller P/E ratio (Figure 1).
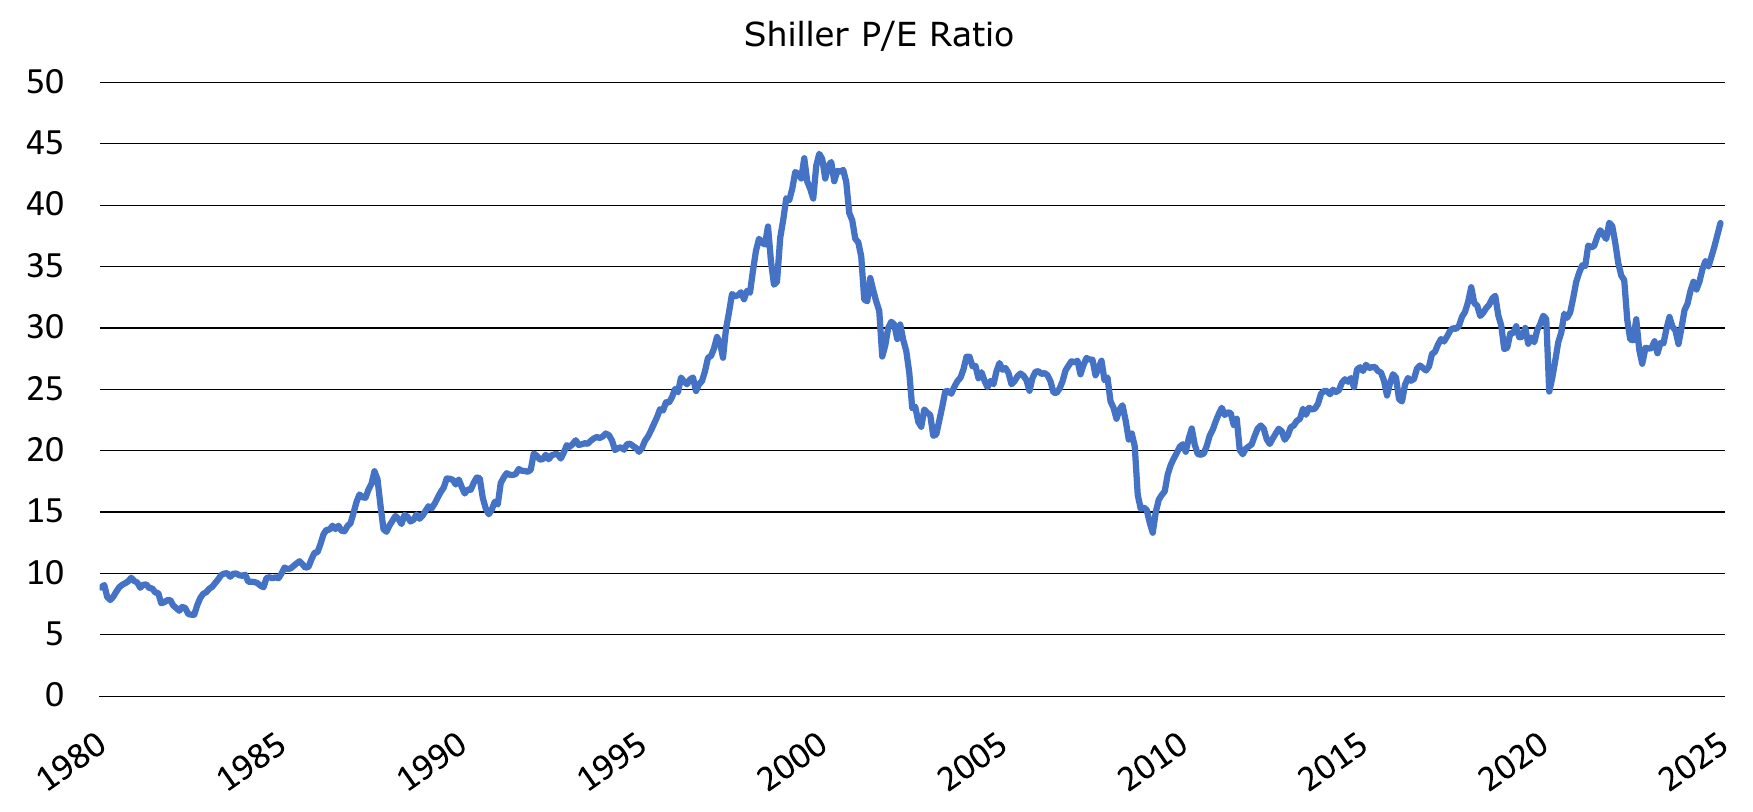
Shiller P/E Ratio The Shiller P/E ratio of 38.55, as of December 10 , is near historical highs, surpassed only during the dot-com mania of the late 1990s. This doesn’t, however, definitively prove that equities are overpriced or that the market has rallied excessively; in fact, the high mark can be partly attributed to rapid earnings growth in recent years. Given that this metric is cyclically adjusted, it incorporates inflation-adjusted earnings over the past 10 years, smoothing out the effects of business cycles as intended. Another measure to review is the non-cyclically adjusted P/E ratio (Figure 2), based on the most recent earnings data.
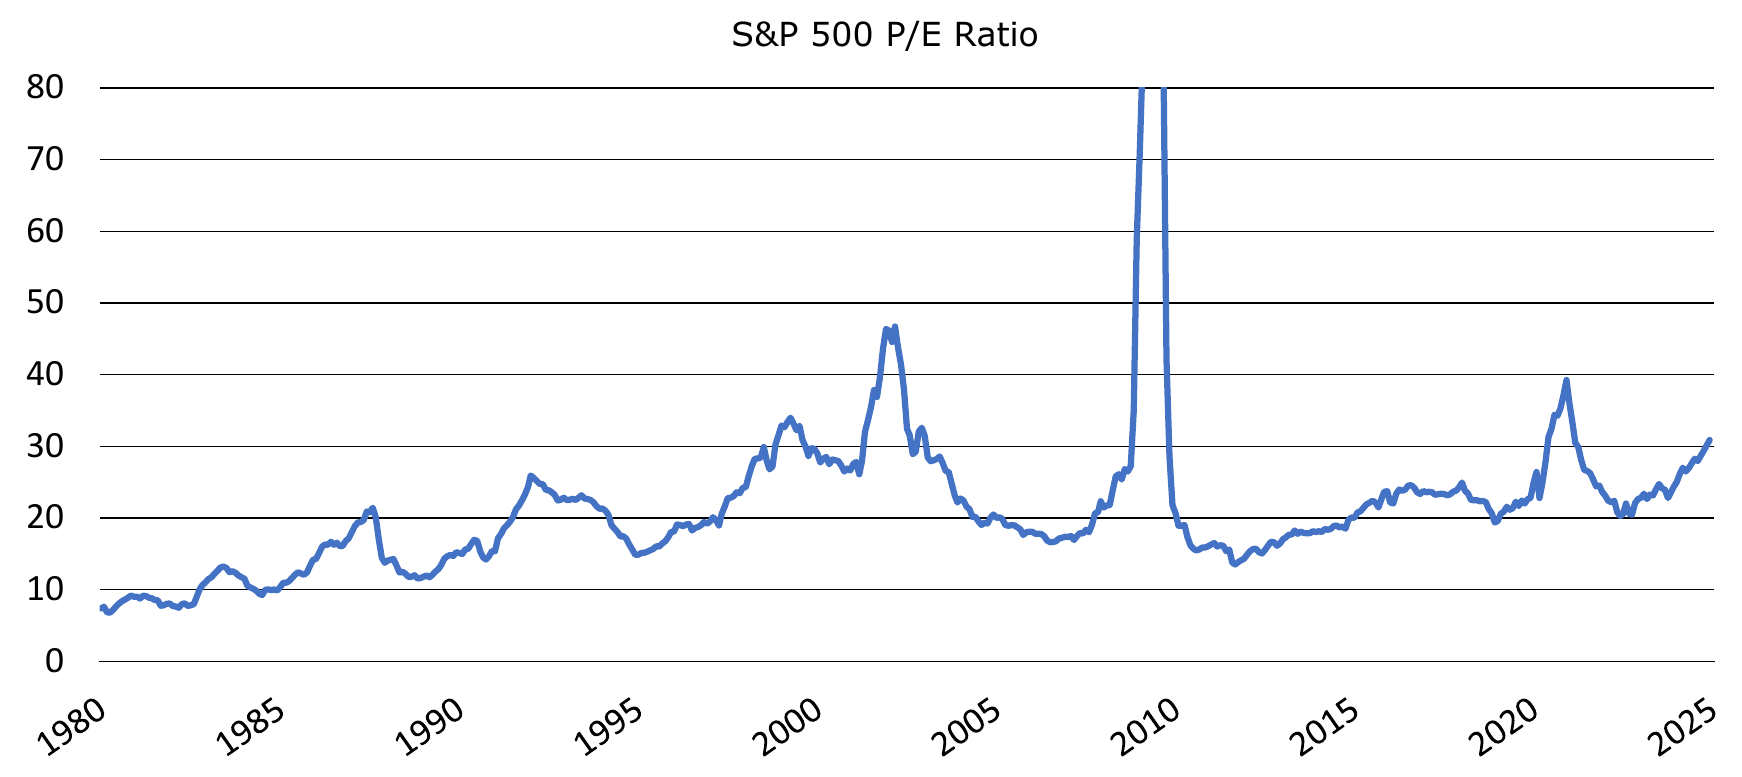
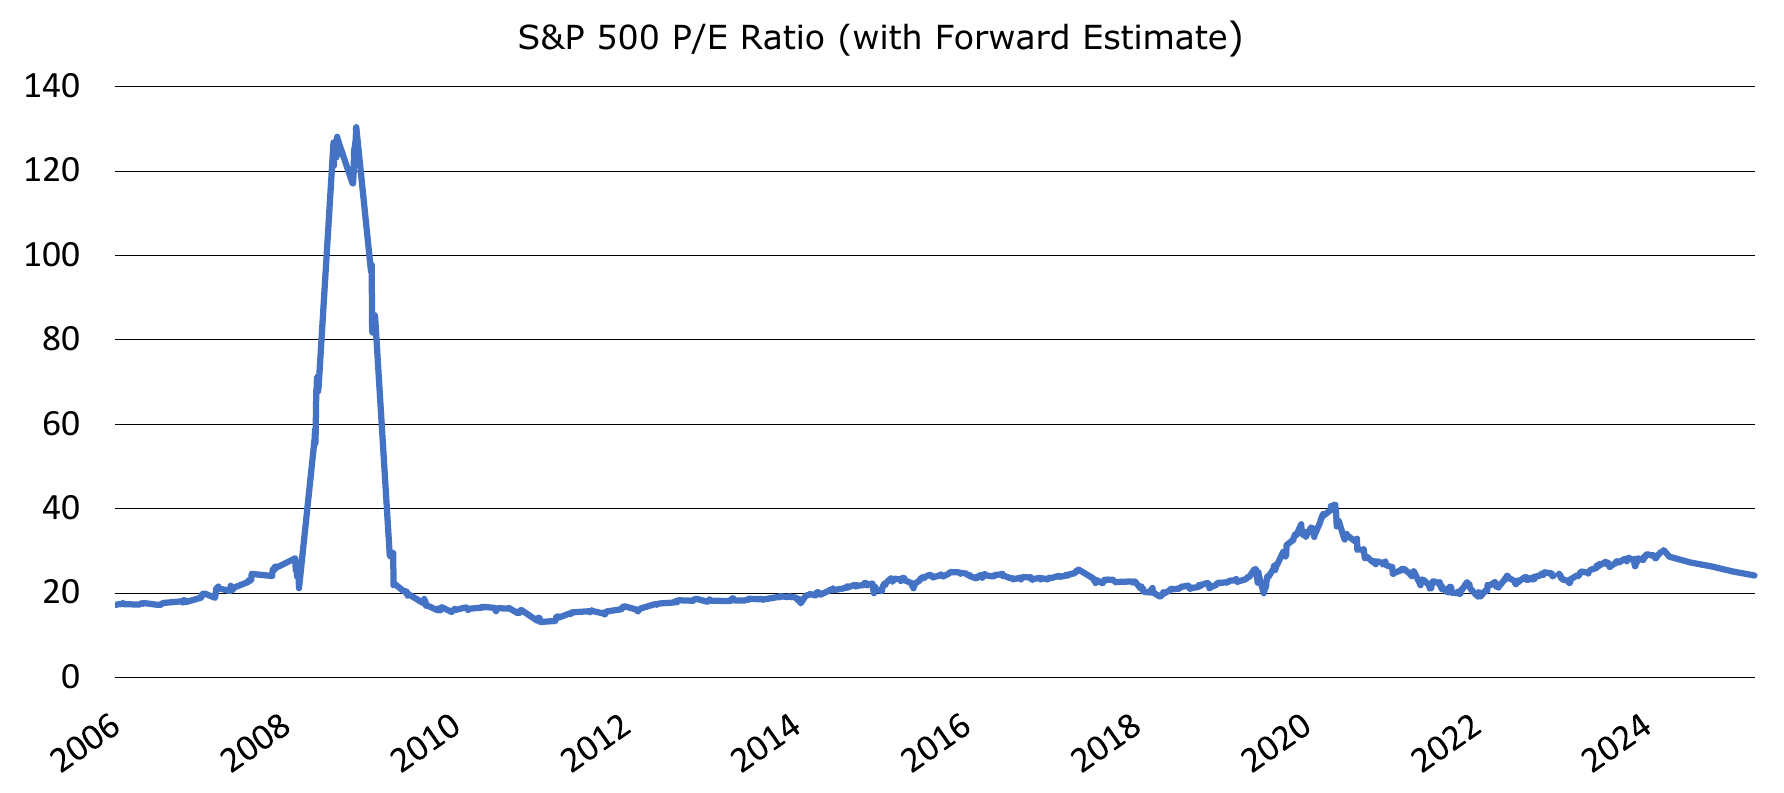
Historically, periods with high P/E multiples have often coincided with sharp declines in earnings (“E”) due to economic recessions. For example, during the financial crisis, the S&P P/E ratio spiked to 123.7, not because equities were expensive but because financial firms were reporting negative earnings. The CAPE ratio attempts to address such distortions but introduced its own drawbacks, such as a “memory bias.” Importantly, current P/E ratios do not account for analyst estimates or projected earnings growth. The forward P/E ratio, as shown in Figure 3, addresses this limitation by incorporating forward earnings estimates and currently appears closer to historical averages. However, its mean and variance are skewed by periods of elevated P/E multiples during earnings recessions. Additionally, forward estimates are inherently subjective and can be distorted for reflecting market sentiment, for example. Analysts are currently projecting significant earnings growth for the S&P 500, with per cent increases in the low to mid-teens, particularly among large-cap companies. This may well prove to be wishful thinking.
Factors That May Be Cited for Justifying the High P/E Ratio
While we remain skeptical, some factors could be cited to justify high P/E metrics. For example, technological advances may drive future income growth through efficiency gains and the increased capitalization of tech companies naturally boosts P/E multiples. Another argument is that machine learning and AI could make the S&P 500 more efficient and streamlined. We doubt that these factors can fully justify current valuations. Indeed, history teaches us that new technologies have not led to permanent margin expansion. For example, the adoption of automobiles in the early 20th century didn’t turn transport companies into profit machines; much of the benefit was passed on to consumers as the technology became widely adopted and cheaper to replicate. We expect a similar outcome for machine learning-based technologies. While these innovations will benefit society and contribute to GDP growth, we remain skeptical that corporations will capture a significantly larger share of GDP as profit margins. Competitive pressures, along with taxes and regulations, will act as natural barriers to sustained margin expansion.
Higher Interest Rates Are Supposed to Push P/E Multiples Lower - and They Eventually Will!
Another reason we are skeptical of P/E multiple expansion is the rise in long-term interest rates over the past few years. Under the Capital Asset Pricing Model (CAPM) and its derivatives (e.g., multi-factor models), higher risk-free rates increase expected returns for equities. As investors demand higher returns, they apply greater discount rates to future cash flows. All else being equal, rising long-term rates in the US should put downward pressure on P/E multiples. Practically, as higher nominal (and real) yields become available, prudent investors are likely to allocate more to risk-free assets or demand higher returns from risky assets in their portfolios.
When evaluating today’s higher rates compared to the 2010s and early 2020s, one could argue that equity markets now exhibit their highest interest rate-adjusted valuations since the mid-2000s. In other words, the markets haven’t been this optimistic since 2007. Of course, under CAPM and other asset pricing models, earnings growth could justify higher valuations—particularly if the perceived increase in earnings growth exceeds the rise in risk-free rates. However, as noted earlier, such perceptions and expectations of earnings growth may signal market euphoria and a potential market top.
Credit Markets Show Similar Signs of Euphoria
Market optimism isn’t confined to public equities; similar dynamics are evident in the credit markets. High-yield and investment grade credit spreads are at historical tights even as signs of credit quality erosion emerge.
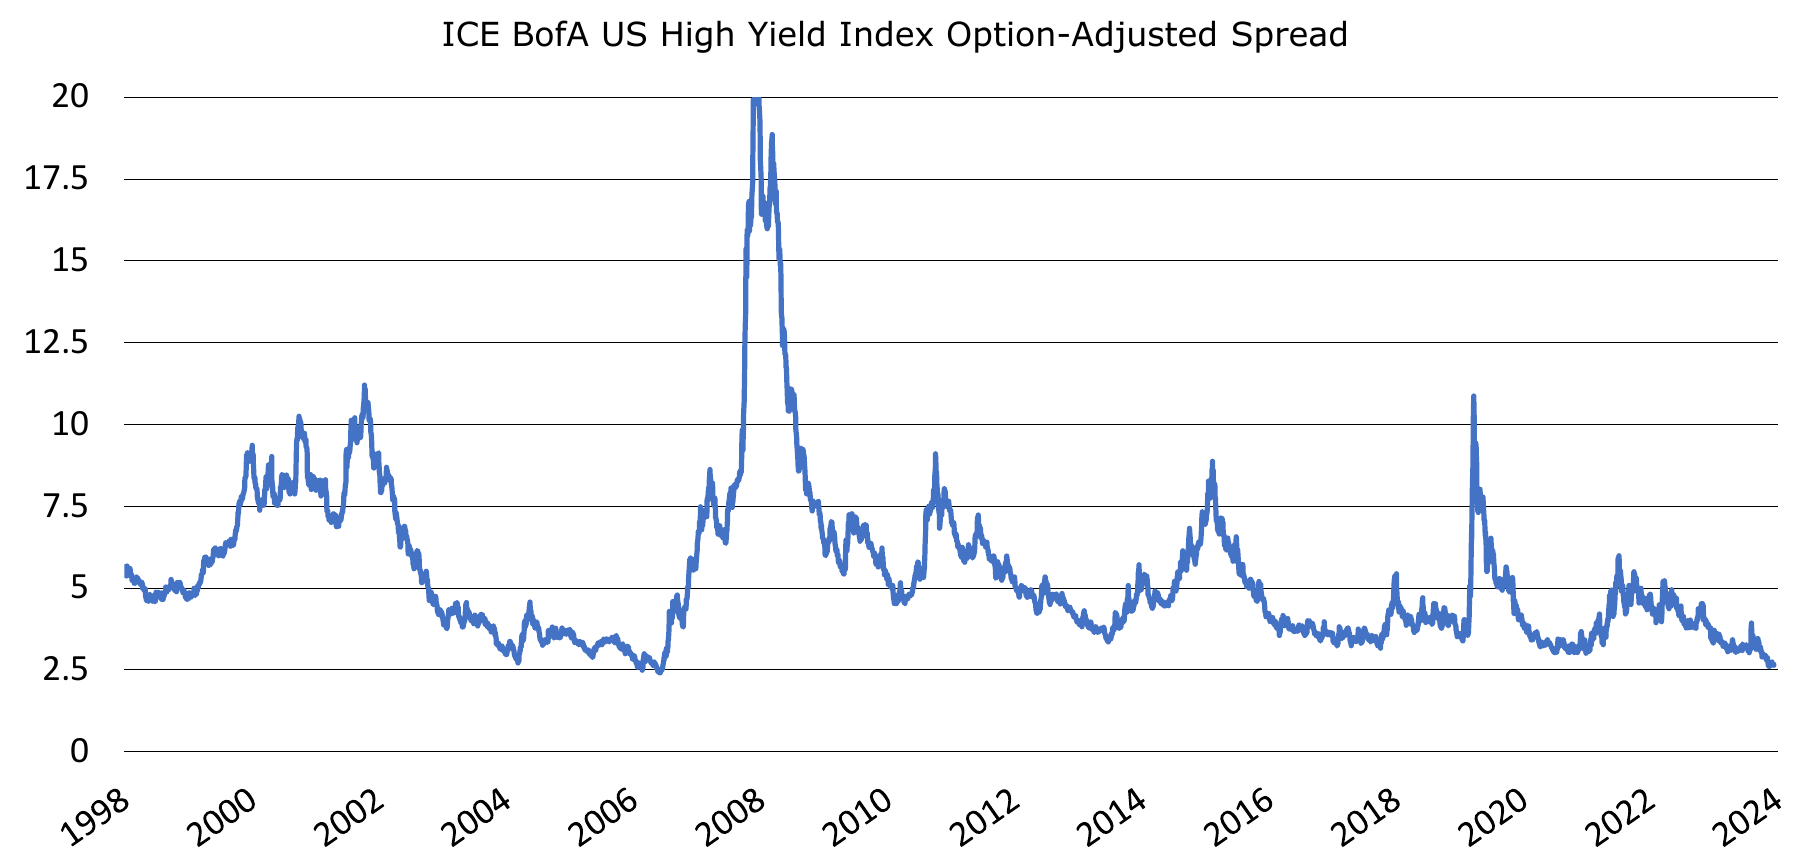
Although from a different market, the Bank of America US High Yield Index OptionAdjusted Spread shown in Figure 4 still tells the same story—credit spreads are as tight as they have been in over 15 years. Only briefly during 2007 and 1997 were credit spreads marginally tighter, and the difference was minimal. We do not expect spreads to tighten further from these levels.
Credit Spreads Present an Interesting Short Opportunity
Given current spreads, we view credit products as an attractive hedge. A short position in credit offers limited downside with the potential for significant upside. We have implemented some credit shorts across our investment vehicles and will continue monitoring the market for additional short opportunities.
Disclosures
The information contained in this document is for informational purposes only and should not be considered investment advice. This document does not constitute an offer to sell, a solicitation of an offer to buy, or a recommendation for any security or investment strategy.
Past performance is not indicative of future results. All investments carry risk, including the possible loss of principal. The views expressed herein are those of the author as of the date of publication and are subject to change without notice.
Forward-looking statements are based on current expectations and assumptions, which are subject to risks and uncertainties. Actual results may differ materially from those anticipated.
Monachil Capital Partners LP is a private investment firm. Investment opportunities described herein may be available only to qualified purchasers as defined under the Investment Company Act of 1940.