Introduction and Overview
Welcome to our monthly report, where we aim to highlight topical matters and assess their potential impact on financial markets.
In this report, we examine recent economic data as well as the US Treasury market and reexamine banks with a focus on some of the pressures that they are likely to face.
While we acknowledge that Q3 GDP and other economic data were strong, we do not necessarily view this as sign of strong economic growth because, as we will discuss in more detail, we mainly attribute it to fiscal expansion. Moreover, there have already been downward revisions to some of the data, particularly employment data, which shows that the picture may not be as rosy as it originally appeared.
Over the past few weeks, the market’s tone has shifted positively as treasury yields have declined from their recent highs. One of the drivers of the decline in treasury yields has been the Treasury Department ’s decision to issue fewer long-term notes. In spite of its impact on yields, we find this decision shortsighted and devoid of meaningful long-term benefits. Issuing short-term bills and notes negatively impacts short-term liquidity by crowding and competing with bank deposits (more on this below) and risks adversely impacting banks. Bank deposits have already come under their own pressure as depositors continue to demand higher-yielding products, which has the knock-on effect of increasing stress on bank business models.
Headline economic data somewhat positive, with problems lurking under the surface
Q3 2023 GDP growth came in at 4.9%, significantly higher than the second quarter reading of 2.1%. Although this is reading appears strong, we maintain our skepticism for two primary reasons. First, we continue to believe that GDP expansion is driven by an unsustainable level of government spending and fiscal expansion. Secondly, Gross Domestic Income (GDI) numbers continue to point to a much softer economy. GDI only increased by an annual rate of 0.5% in Q1 and 0.7% in Q2. Readers of our August 25, 2023 commentary may recall our thesis about GDP and GDI data needing actually to converge.
As a result, we remain in the camp where a soft landing, which we define as combination of low inflation (less than 2%), no recession and sustainable fiscal policy with deficits staying at 3% of GDP, is not achievable. Furthermore, the most recent round of economic data does not change that view. Inflation is still substantially above 2%, with GDP at 3.5% and PCE Core Deflator at 3.7%, which is compounded by a federal deficit approaching 7% of GDP. While the Congressional Budget Office (CBO) estimate for the full fiscal year deficit (October 2022 to September 2023) came in at $1.7 trillion (CBO FY 2023 Report), that included a $333 billion accounting benefit related to the Supreme Court decision that prohibited broad student loan forgiveness. The costs associated with the loan forgiveness program significantly increased the official deficit in 2022, only to be artificially reversed in the deficit reading for 2023.
Revisions to employment data continue to be material and have been consistently lower over the past few months
Non-farm payrolls increased by 150k in October, which shows a cooling down from the 336k increase initially reported for September. More noteworthy, we believe, were the subsequent downward revisions to non-farm payroll data in August and September to increases of 165k (from 227k) and 297k (from 336k), respectively.
We have not yet found a rational explanation for the initial over-estimation of payroll gains, but this trend of positive overreporting only to be followed by notable downward revisions has dominated economic data in 2023.
Unemployment data for October 2023 showed an increase to 3.9% compared to July’s reading of 3.5%. Despite the August increase, both are low by historical standards. Given the current structure of the economy, which relies heavily on government deficit spending for growth, the unemployment rate would need to continue to move higher to bring inflation below 2%.
Furthermore, over the longer term, government deficit spending will need to be balanced out by a higher domestic savings rate, which would apply downward pressure on consumption and investment by the private sector.
Back to Treasuries:
On November 1, 2023, the Treasury Department announced its financing schedule for Q4 2023. The Treasury financing schedule becoming a market-moving event is both noteworthy and a sign of things to come. A significant decline in 10-year and other long-term yields was driven by the Treasury ’s decision to unexpectedly decrease the growth of its longer-term debt auctions in favor of issuing more short-term debt.
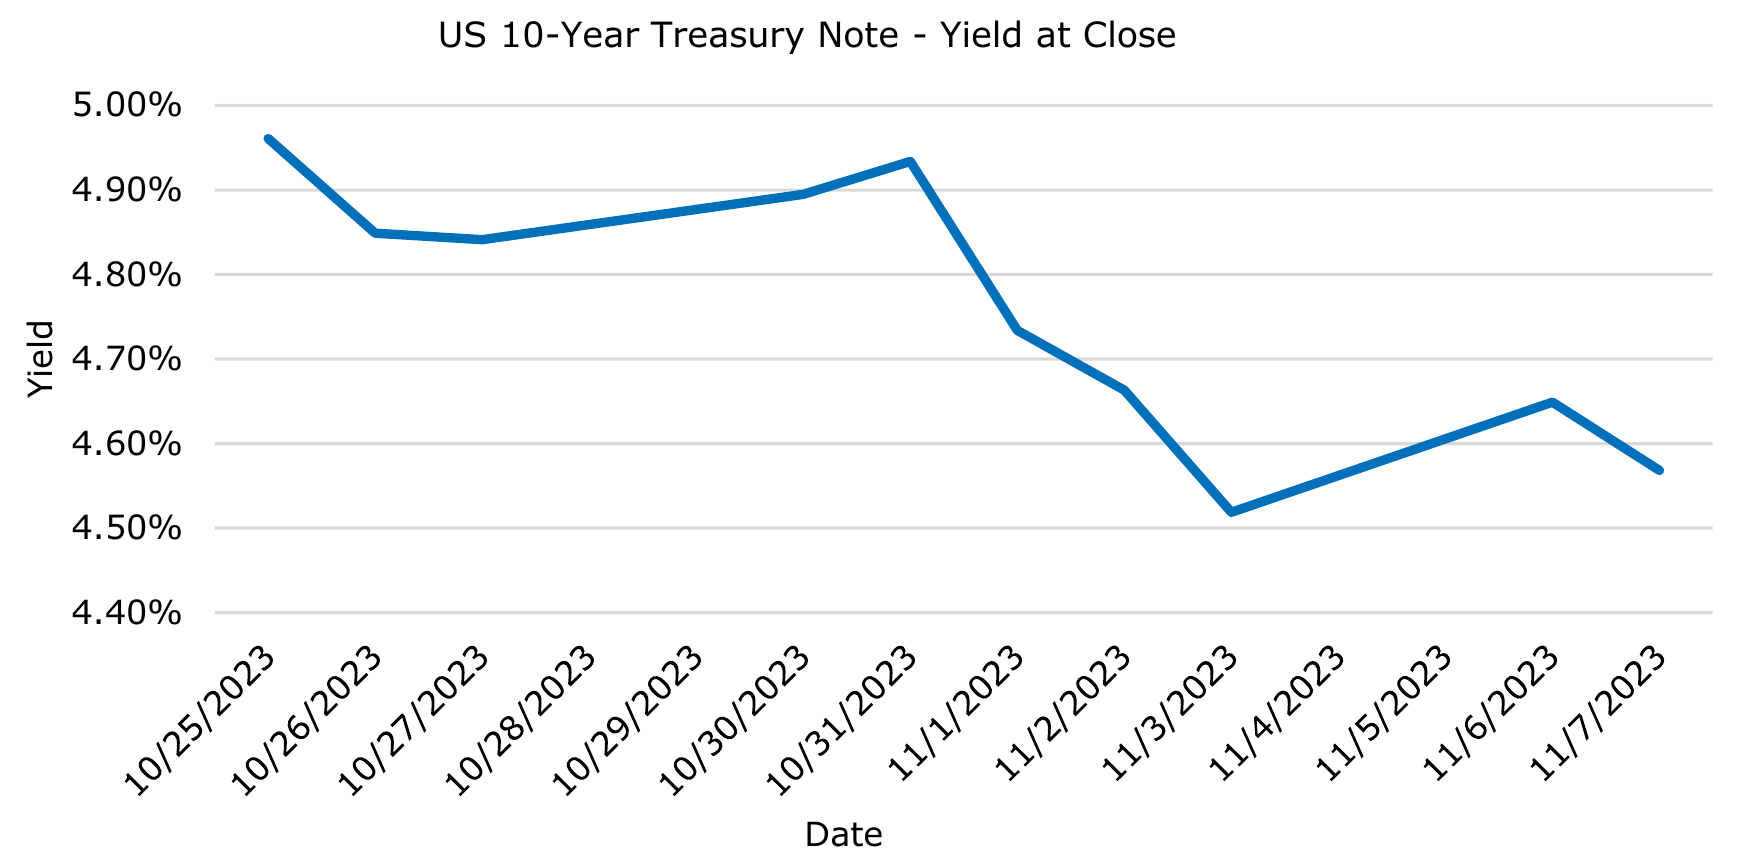
We will admit to being surprised by the ensuing market reaction, especially given that the overall size of the reduction was not material when compared to the size of the treasury market. Indeed, 10-year and 30-year issuances were reduced by only $1bn as compared to August. The fact that such small shifts in the issuance schedule could trigger significant moves in yields — with crosscurrents in equity and credit markets — is an intriguing phenomenon.
The fact that even small changes created such turmoil across markets further points to a question that will hover above markets over the next few months with ominous implications. That is, Who will be the marginal buyer of long-term Treasuries and at what price?
It is our observation that the marginal buyer of long-term Treasuries keeps shifting as supply significantly increases. As more supply hits the market, the marginal buyer will start to shift away from central banks and foreign investors and will instead become households, who will both directly and indirectly (i.e. through pension plans) acquire Treasuries.
A further implication of households ’ increased participation in Treasuries will be the demand for higher real yields. In our view, households which become marginal buyers of Treasuries will need to increase their savings, while potentially selling down other investments in order to buy these Treasuries.
In short, increased savings stemming from higher yields will push down consumption in the long term, thus helping to lower inflation. It is precisely this transmission mechanism that many macroeconomic models use to examine the impact of higher real yields on savings and consumption.
As the need to pay an amount necessary to attract private balance sheets increases, another phenomenon will very likely occur. Treasury holdings will displace holdings of other assets, including equities and equity-like instruments. This can happen directly through households’ brokerage accounts, IRAs and 401ks, or indirectly through pensions and insurance companies. In all outcomes, the allocation of investment portfolios will need to change to make room for more long-term Treasuries that need to attract more inflows.
Supply of Treasuries: short-term vs. banks, long-term vs. equities
A very simplified, but also insightful, view of the impact of changes to short-term and long-term Treasuries holdings is to look at what part of the household balance sheet they will tend to crowd out.
Short-term treasuries, including T-Bills, typically tend to crowd out bank deposits and are absorbed through a variety of “cash equivalent” mechanisms like money market funds or individual brokerage accounts. As the government increases the supply of these instruments, you can expect more pressure on bank deposits. During previous periods of non-zero interest rates, banks would offer competitive deposit rates and then simply invest those deposits in higher yielding government securities. We believe that the market structure has changed , in part because of consumers’ easier access
to short-term treasuries, and banks now face the threat of disintermediation as households are now able to more easily hold T-Bills directly.
Long-term Treasuries, on the other hand, are likely to be viewed as an investment product that will compete with household equity allocations while making portfolio savings decisions. The inevitable increased supply of long-term treasuries will push up real yields while forcing investors to demand higher returns for both equity and nongovernment fixed income holdings. To put a fine point on it, a higher supply of longterm Treasuries will push equity valuations lower in the long run.
Therein will lie the challenges that the financial markets will face over the next few quarters. Irrespective of where inflation numbers are going (and we think they will continue to remain stubbornly above 2%), an increased supply of long-term Treasuries will continue to adversely impact pricing for long duration assets while an increased supply of short-term Treasuries will put more pressure on banks. Switching the relative supply between long-term and short-term Treasuries may mitigate some issues in the short-term, but over the longer term we expect that the Treasury will find that it traded one set of challenges for another with no incremental net benefit.
New signs of stress are already re-emerging in short-term markets : Fed’s Reverse Repo Facility
Additional signs of stress are starting to emerge in the short-term liquidity and funding market. A barometer for the short-term funding stress is the decline in utilization of Federal Reserve Overnight Reverse Funding Facility (ON RRP).
In this market, funds (such as money market funds) and financial institutions with surplus cash can invest their excess liquidity with the Fed (receiving treasuries as collateral). The utilization of the ON RRP facility, however, has declined precipitously over the past year (see Figure 2). At its peak, utilization exceeded $2.4tn.
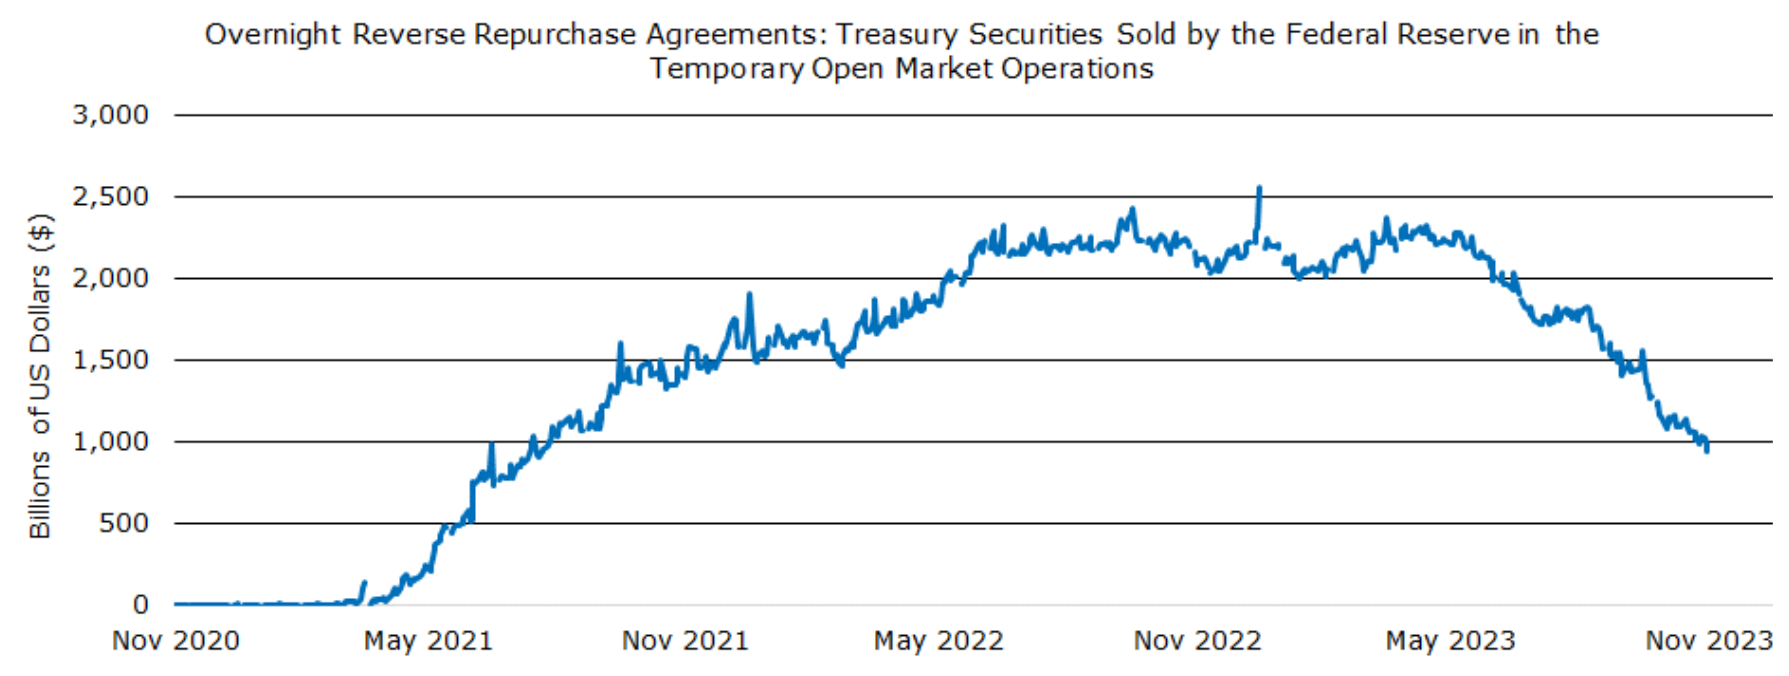
During the period of May 2022 to May 2023, for example, that amount remained above $2tn. It has now sharply decreased and, as of November 15, stands at approximately $944bn.
It should be noted that most of the growth in this facility took place during a period of monetary and fiscal easing following 2021. The facility size approaching and remaining near zero is a sign of monetary policy normalization. For example, the facility remained at near zero from 2018 through early 2021 except for March and April 2020.
We see this reduction as an indication of declining excess liquidity in the system. Indeed, we consider this an important bellwether of stability, and one which we will continue to monitor carefully. For now, the stubborn drop in the ON RRP facility’s use suggests, we believe, the likelihood of other problems emerging which may even exacerbate the already dramatic reductions.
Opportunities to Come
We are very skeptical of the recent relative calmness in the markets and are focused on maintaining a conservative liquidity profile to ensure that we have ample dry powder as opportunities emerge. As such, we remain very selective in where we take risk.
Disclosures
The information contained in this document is for informational purposes only and should not be considered investment advice. This document does not constitute an offer to sell, a solicitation of an offer to buy, or a recommendation for any security or investment strategy.
Past performance is not indicative of future results. All investments carry risk, including the possible loss of principal. The views expressed herein are those of the author as of the date of publication and are subject to change without notice.
Forward-looking statements are based on current expectations and assumptions, which are subject to risks and uncertainties. Actual results may differ materially from those anticipated.
Monachil Capital Partners LP is a private investment firm. Investment opportunities described herein may be available only to qualified purchasers as defined under the Investment Company Act of 1940.